
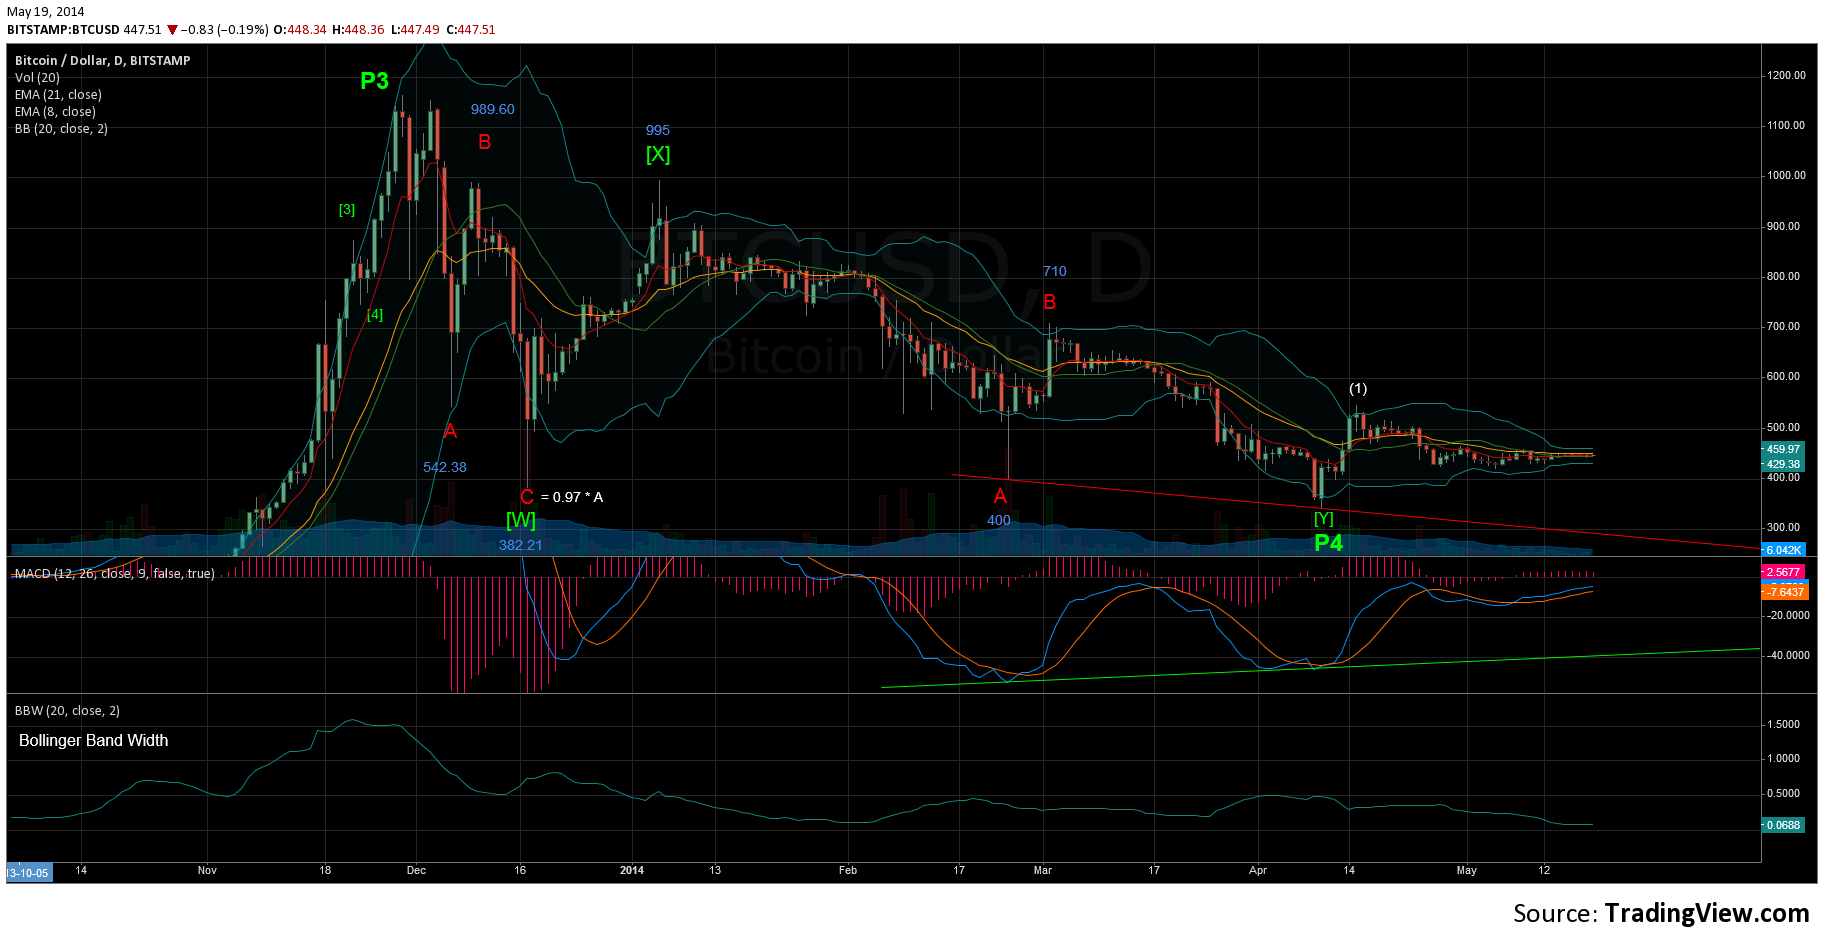
Bitcoin price has been difficult to count and indecisive for the past month. Let’s start this update by taking a look at the daily chart for clues on the current trend. I notice the following important points from the daily chart.
- Price has failed to stay above the 21 day EMA (listed on top left of the daily chart), which means that the downtrend is still intact.
- Daily RSI(14) [not shown in the chart] has stayed below the midline of 50, suggesting that the downtrend has not been broken.
- The Bollinger Band Width, the space between the top and bottom bollinger bands, is extremely small right now. This happens preceding a large directional move, but does not give clues as to which way that move will be.
Now let’s look at the hourly Bitcoin chart for a more in-depth wave count. I am counting the price action over the last month as a wave (2) of the primary.
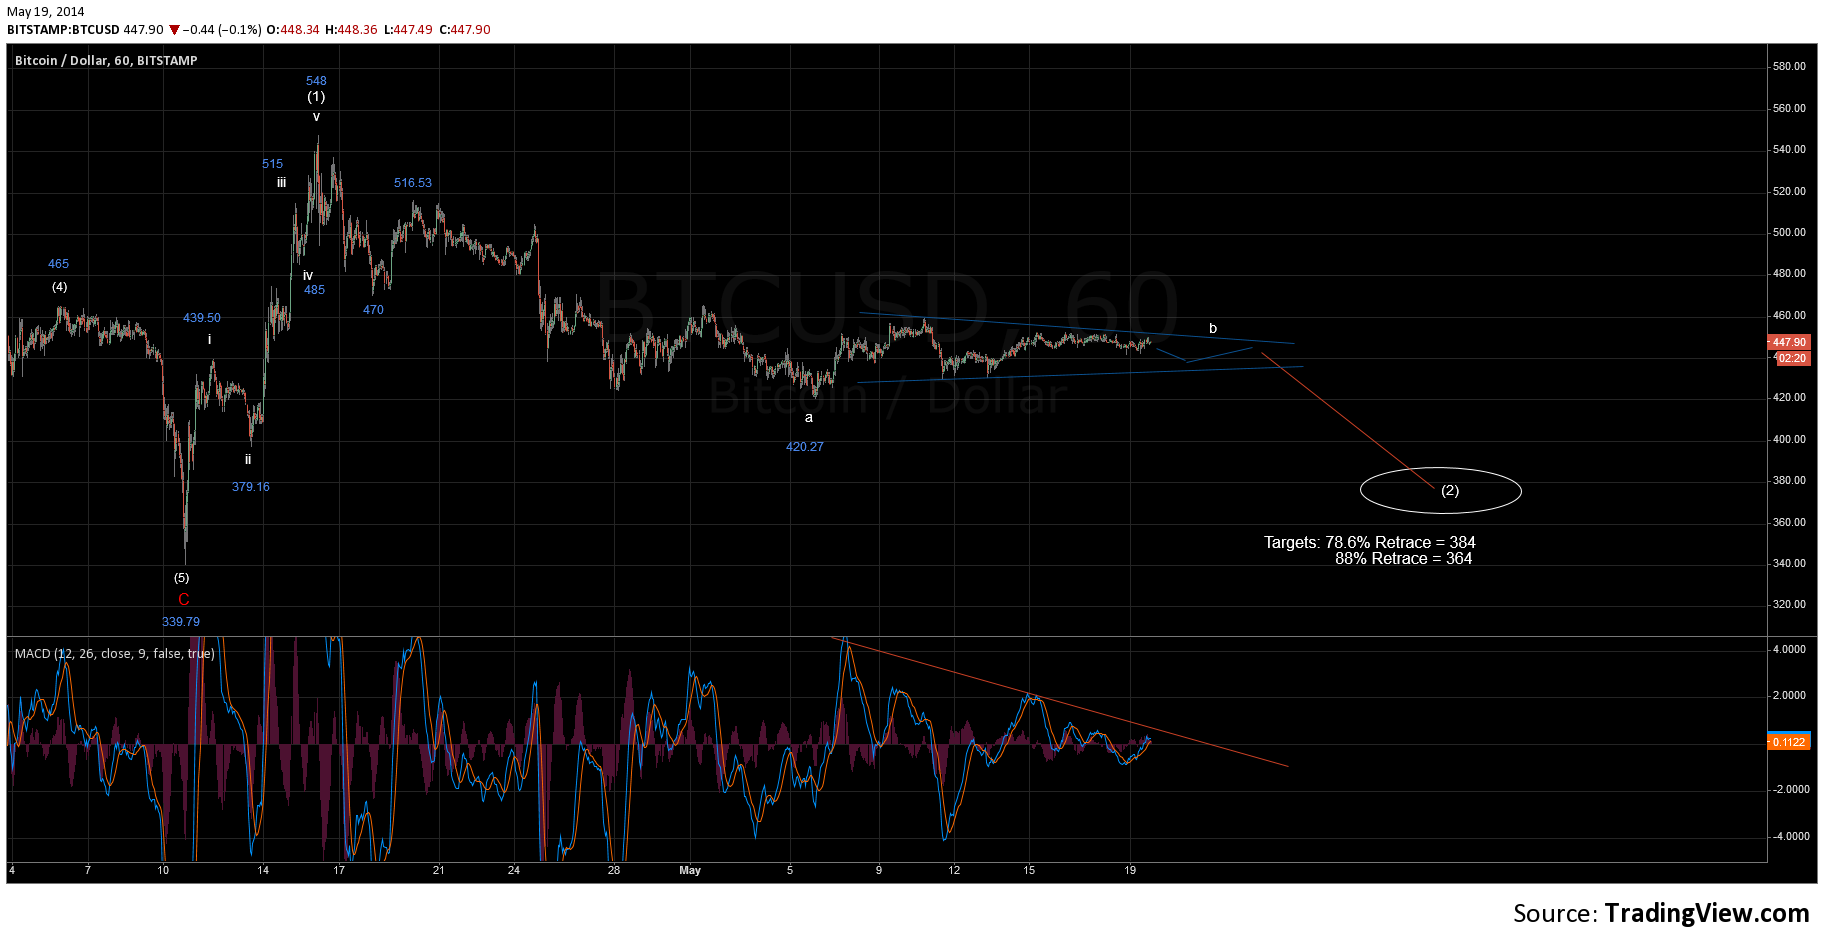
Range bound price action over the past 2 weeks suggests that wave b-(2) is playing out as a triangle. Once price drops below the lower trendline of the triangle (dark blue line) BTC price should see a drop below $420 for wave c-(2). The intial target for wave c-(2) is $375, the 78.6% retrace of wave (1). Wave c-(2) must stay above the recent low of 339.79. More realistically, price should not drop below the 88% retrace of wave (1) at $364. The sideways movement from the 420.27 low also shows that (2) is still underway. If a new uptrend was happening then there would have been a more convincing impulse move upwards.
My previous update labelled the move off the recent $339 bottom as a major low and the current uptrend as a (1) move off the low. That count is still the primary even though the wave 5-(1) move for a new high above $550 from the April 22nd update was never hit. Should price drop below $339.79, then the count has to be modified. If price rises above $500 then I would move the wave (2) low to $420, but this is an unlikely count considering the lack of an impulsive move upwards in price.
Do not forget about the TIGHT BOLLINGER BANDS that are suggesting a large directional move in either direction for Bitcoin price.
1 comment
Author
Wave b-(2) playing out as a zig zag instead of triangle. 62% retrace of (1) at 500 just hit, shouldn’t go above the 78% retrace at 520 if correct.