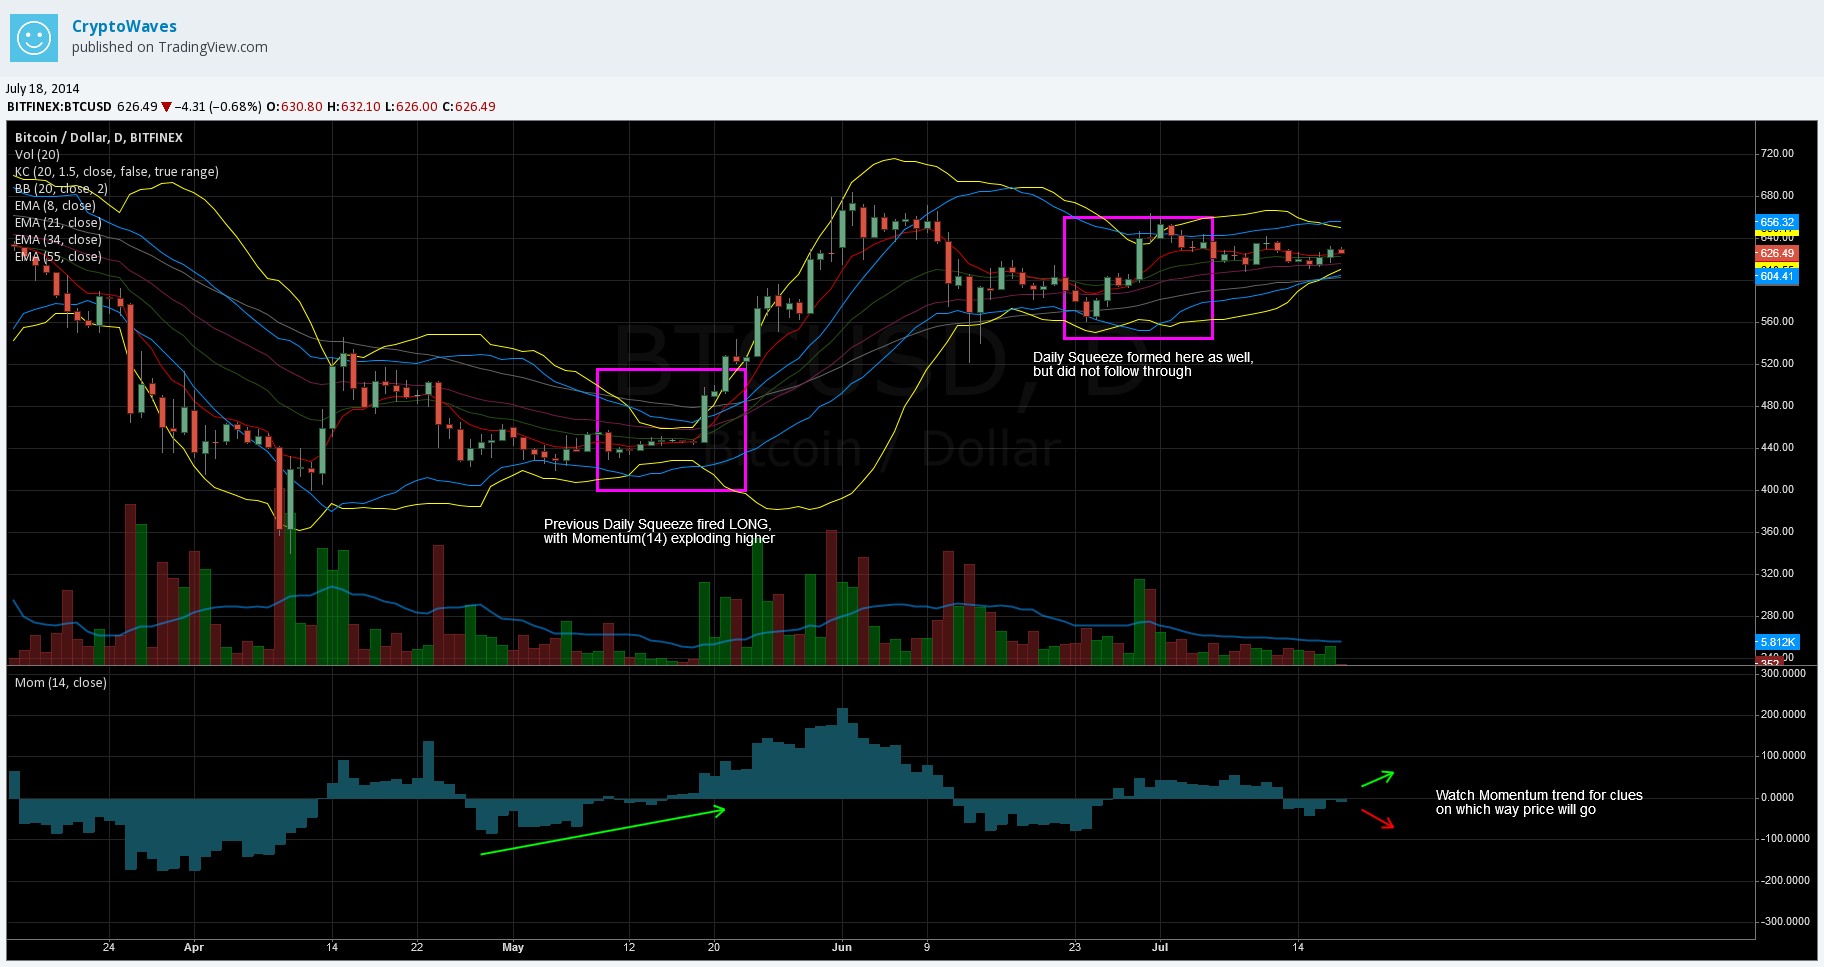
Another daily squeeze has formed on the daily chart for Bitcoin. The last one did not follow through with its move. Let’s see what it has in store this time.
The squeeze triggers once the yellow Bollinger Bands move outside of the dark blue Keltner Channel. So, we are in waiting mode right now. After it triggers, play Bitcoin in direction of the trend. If the Elliott Wave count proposed in my previous post is correct then this squeeze will fire short. Look for the move to establish direction then follow the trend.
Note that the squeeze can ‘set up’ for multiple days. For example, price moved sideways for 5 or 6 days back in May before price exploded higher.
Check out my previous squeeze post for a more in depth description of this indicator.
http://www.cryptowaves.com/long-btc-on-daily-momentum-squeeze-indicator/