
By my count, Bitcoin price is currently rising in a Wave 3-[5]-P1 move higher. The 1.62 * Wave 1 extension of the move is at 739.94. I expect bitcoin price to hit some resistance around that area, shown by the first white circle. The new red trendlines are a parallel channels, with slope matching the line connecting the wave [2] and wave [4] bottoms. The target for the end of wave [5] is within these red channels. Early resistance in price upward movement may come at the first red channel line.
Fib targets for the end of Wave [5] are between the following, also shown on the 4-hour chart below.
1.62 * [1] = 673.65
2.62 * [1] = 822.20
Price should not move straight up to the end of wave [5]. Expect some sideways chop for wave 4-[5] before the final move up for wave 5-[5]. Another triangle for wave 4 would fool the most traders and create a base for the final move of P1.
This wave count is a slight revision from my previous wave count which had the BTC top at 504 in November 2015 labelled as the end of P1. Instead, I call that top wave [3] of P1. I feel that this wave timing matches much better, since my previous count had wave P2 lasting a too short an amount of time. Also, the sideways movement that occurred since that top at 504 counts very well as a A-B-C-D-E triangle for wave [4].
The end of wave [5]-P1 will be followed by a drop for wave P2. Before projecting price targets for that move, let’s concentrate on charting the current move up – P2 targets cannot be extrapolated until the end of P1 is reached.
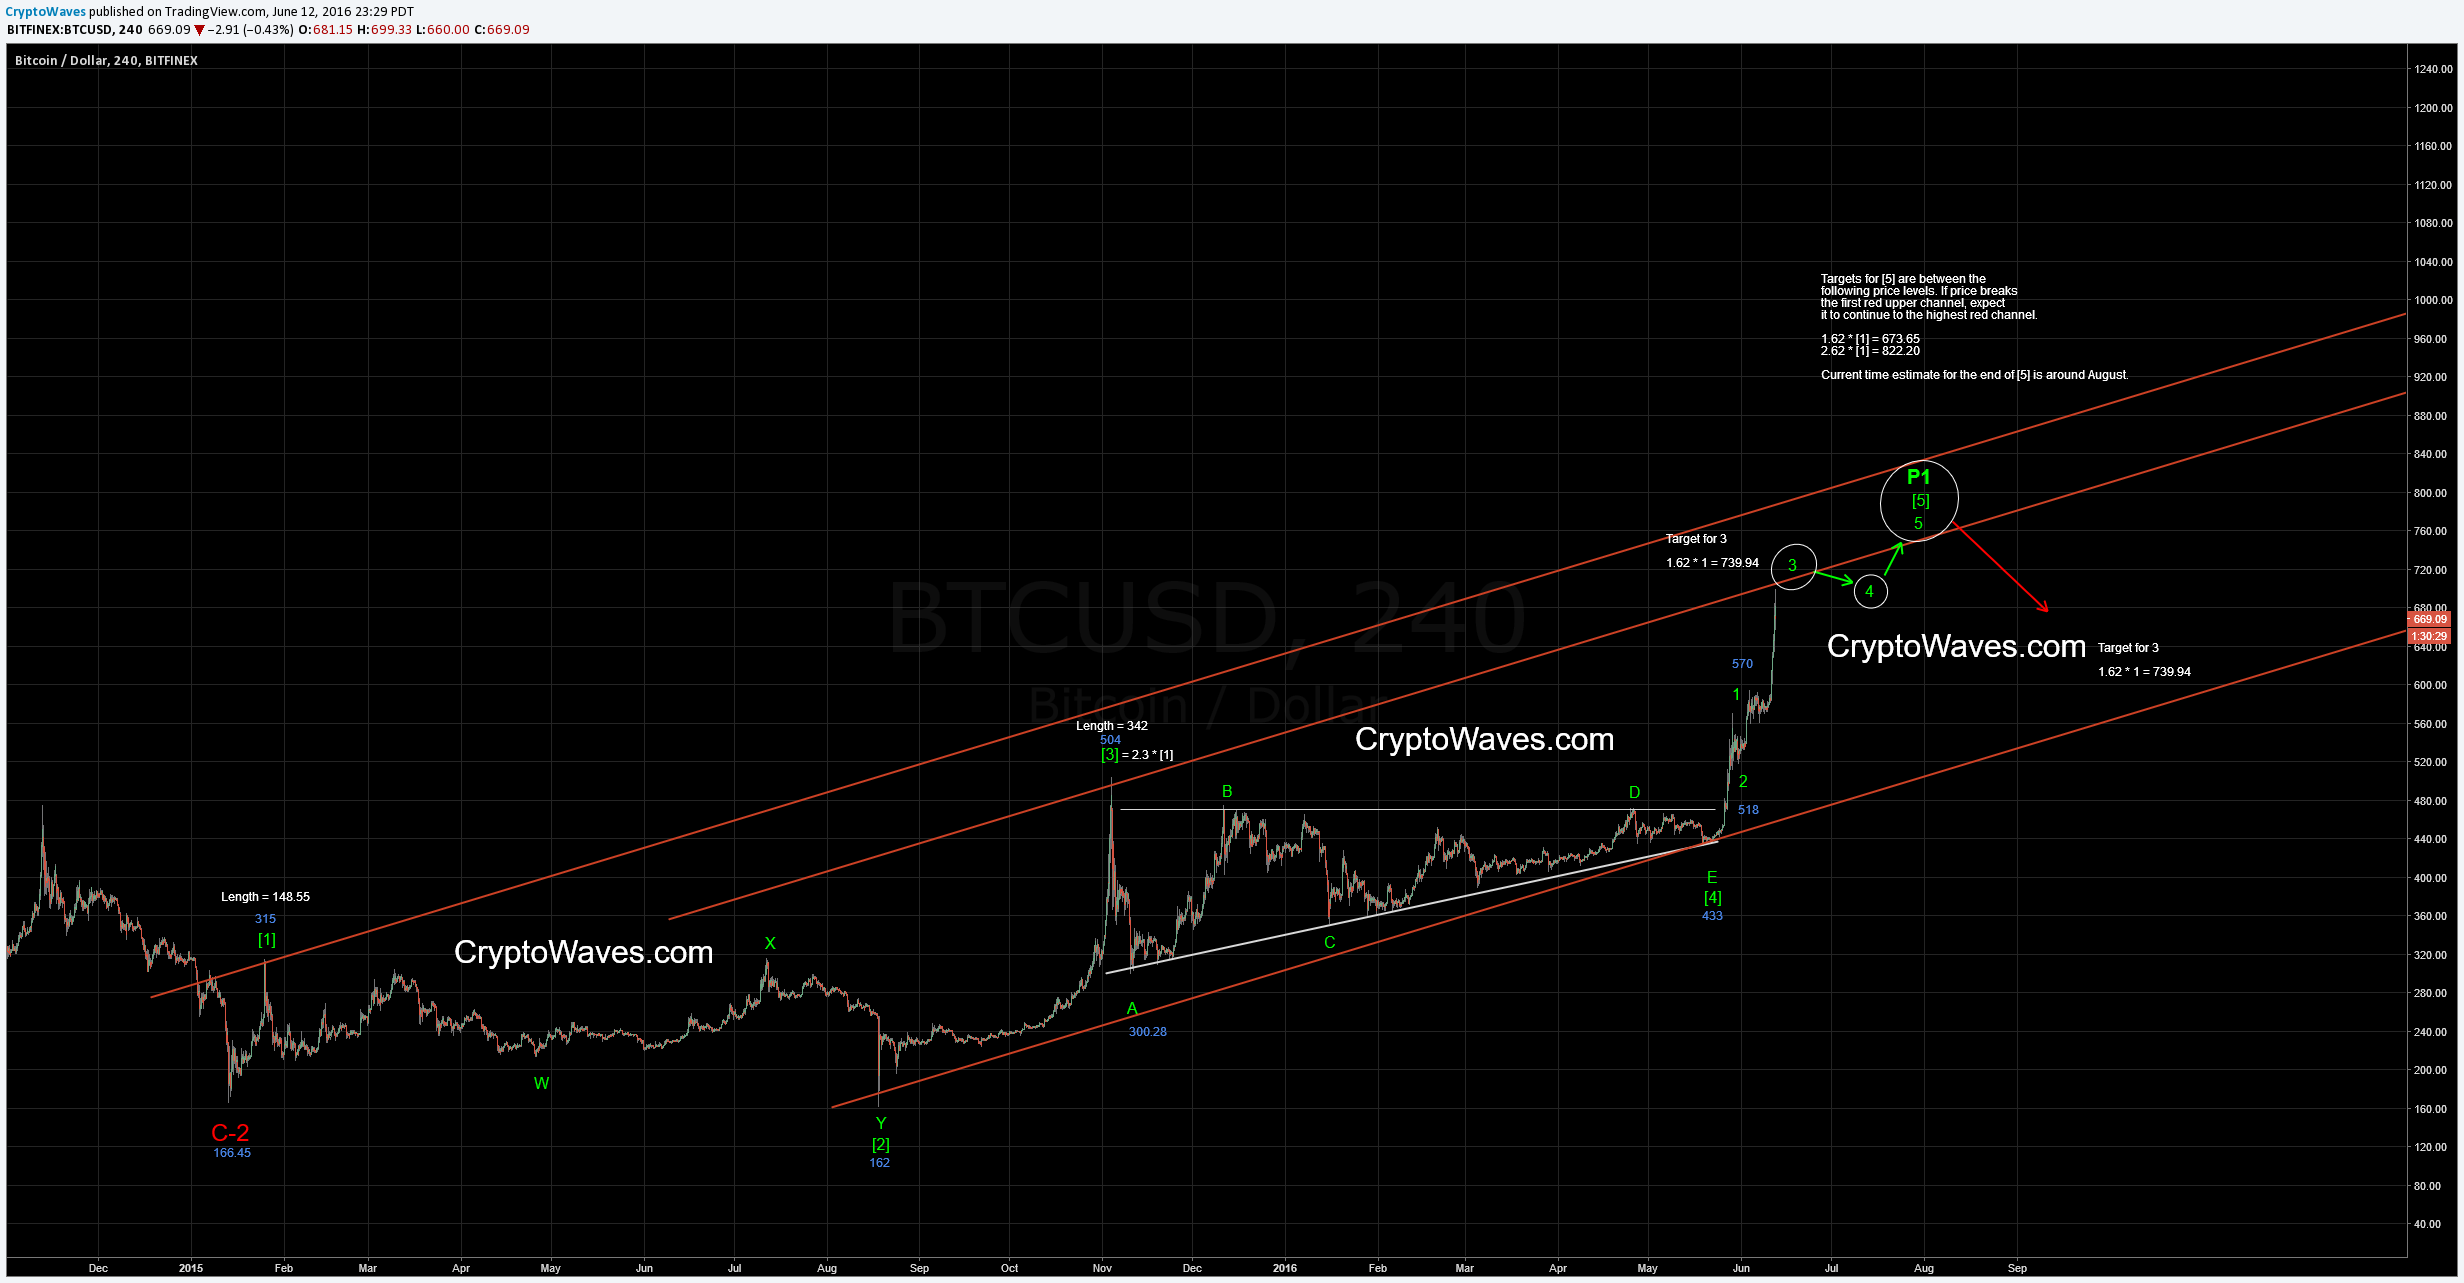
BTC 4-Hour Chart – June 12th, 2016