Tag: Daily Chart

Bitcoin / USD Wave Count Update – May 19th, 2014

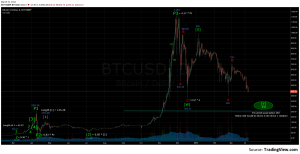
Bitcoin price has been difficult to count and indecisive for the past month. Let’s start this update by taking a look at the daily chart for clues on the current trend. I notice the following important points from the daily chart. Price has failed to stay above the 21 day EMA (listed on top left …

Continue reading

Bitcoin / USD Initial Daily Wave Count – April 2nd, 2014

My initial Elliott Wave count for Bitcoin marks the price drop from the all time high as a Primary Wave 4 (P4) correction. P4 is moving down in a double zig-zag corrective pattern, as labelled in the daily chart below. Major [W] is comprised of a three wave A-B-C move down. This is followed by …

Continue reading