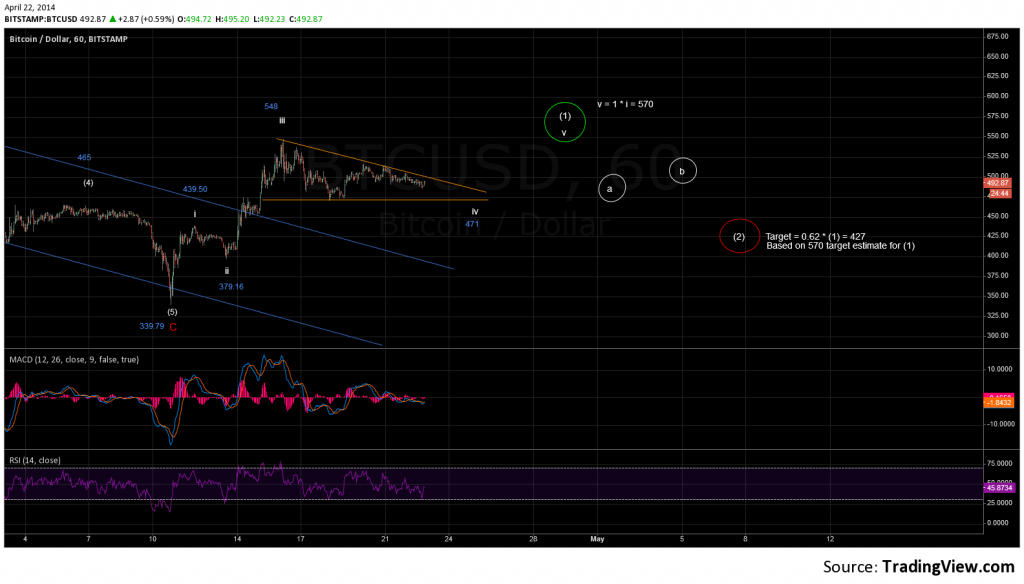
Bitcoin price has been range bound after the recent rise to 548. The overlapping wave structure and shallow price movement suggest that the wave count is still in wave iv-(1). Wave iv is playing out as a descending triangle where price moves sideways as technical indicators move lower in preparation for the next move up. Triangles are notoriously frustrating to trade, so be patient, yet nimble with your positioning. As long as the recent low at 470 holds, which is the bottom of the descending triangle, I see wave v-(1) making a new high above 548. This move will be confirmed when price breaks above the upper trend-line of the descending triangle shown on the hourly chart below.
After the final move up for wave v-(1), price will drop in a wave (2) move lower. The target for this drop is 427, which would be the 62% retrace of a wave (1) move up to 570. If Bitcoin price drops below 470, then a wave count where wave (2) has already started must be considered. Expect the upward thrust of price above the triangle to happen relatively fast. This will fool traders and reset short positions before the wave (2) drop begins.


2 comments
Can you give us a long term view over several years? I’m not familiar with the numbering terminology?
Author
Check out the Daily chart that I posted on April 4th. As far as the numbering terminology, look at the terms listed on the right of the webpage [Wave Labelling]. If you are new to Elliott Wave then check out the ‘Elliott Wave Basics’ page as well.