My last post on Silver outlines the macro trend that I believe Silver is currently tracking. Silver is in a Cycle 3, Primary 3 wave upward – which would be the heart of a massive move up towards new highs. How can we use Elliott Waves to forecast some targets?
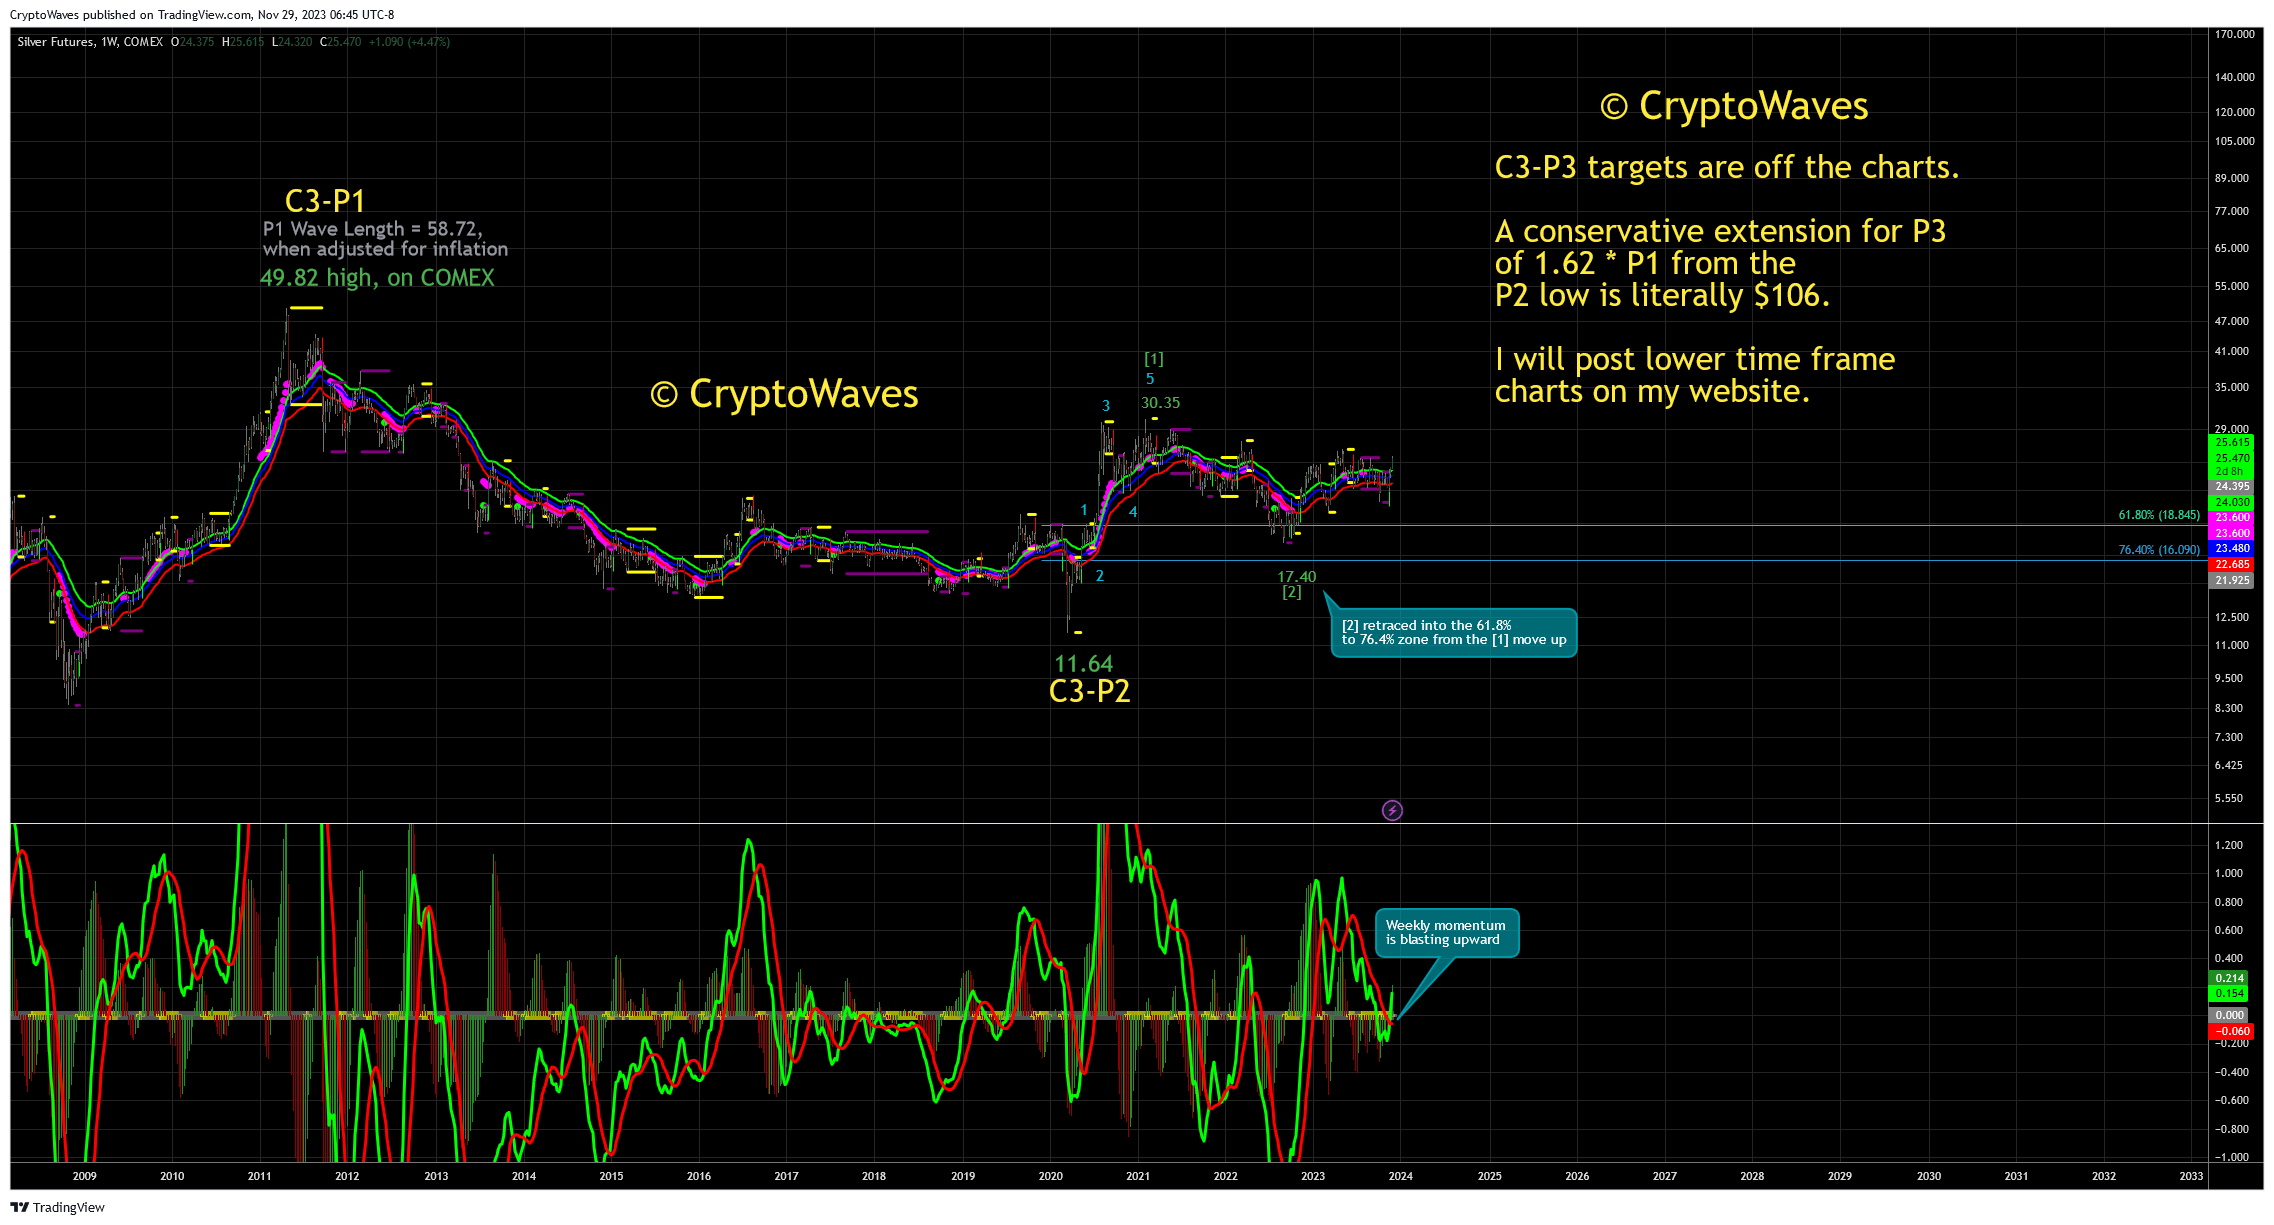
First, let’s look at the Weekly chart. I have applied the same labels of Primary 1 (P1) & Primary 2 (P2) to this chart, as they were applied in my last post. Please consult the wave labels on the right of the webpage if you are not following this.
To project targets for wave C3-P3 up, we must first know the length of the C3-P1 move up off of the C2 low in the early 1990s. The only data that I have dating back to the 1990s is the Monthly Silver price I used as the basis for the chart in my last post. Based on that data, we can find the length of C3-P1, which is the inflation adjusted price of C3-P1 at 66.48 in April 2011 minus the price of the C2 in February 1993 of 7.72, making the length of P1 equal to 58.76.
My lower time-frame chart I have on TradingView has a non-inflation adjusted C3-P1 high of 49.82 on the COMEX Futures, but I feel that the inflation adjusted price is the right number to use for the length of P1. This presents a problem on where to anchor the Wave C3-P3 up though because the C3-P2 low on COMEX is 11.64 in March 2020, but the inflation adjusted C3-P2 low is 16.87 in March 2020.
I will use the COMEX C3-P2 price of 11.64 as the anchor for C3-P3 price projections. A conservative 1.62 * P1 extension for P3 gives a price target of $106.