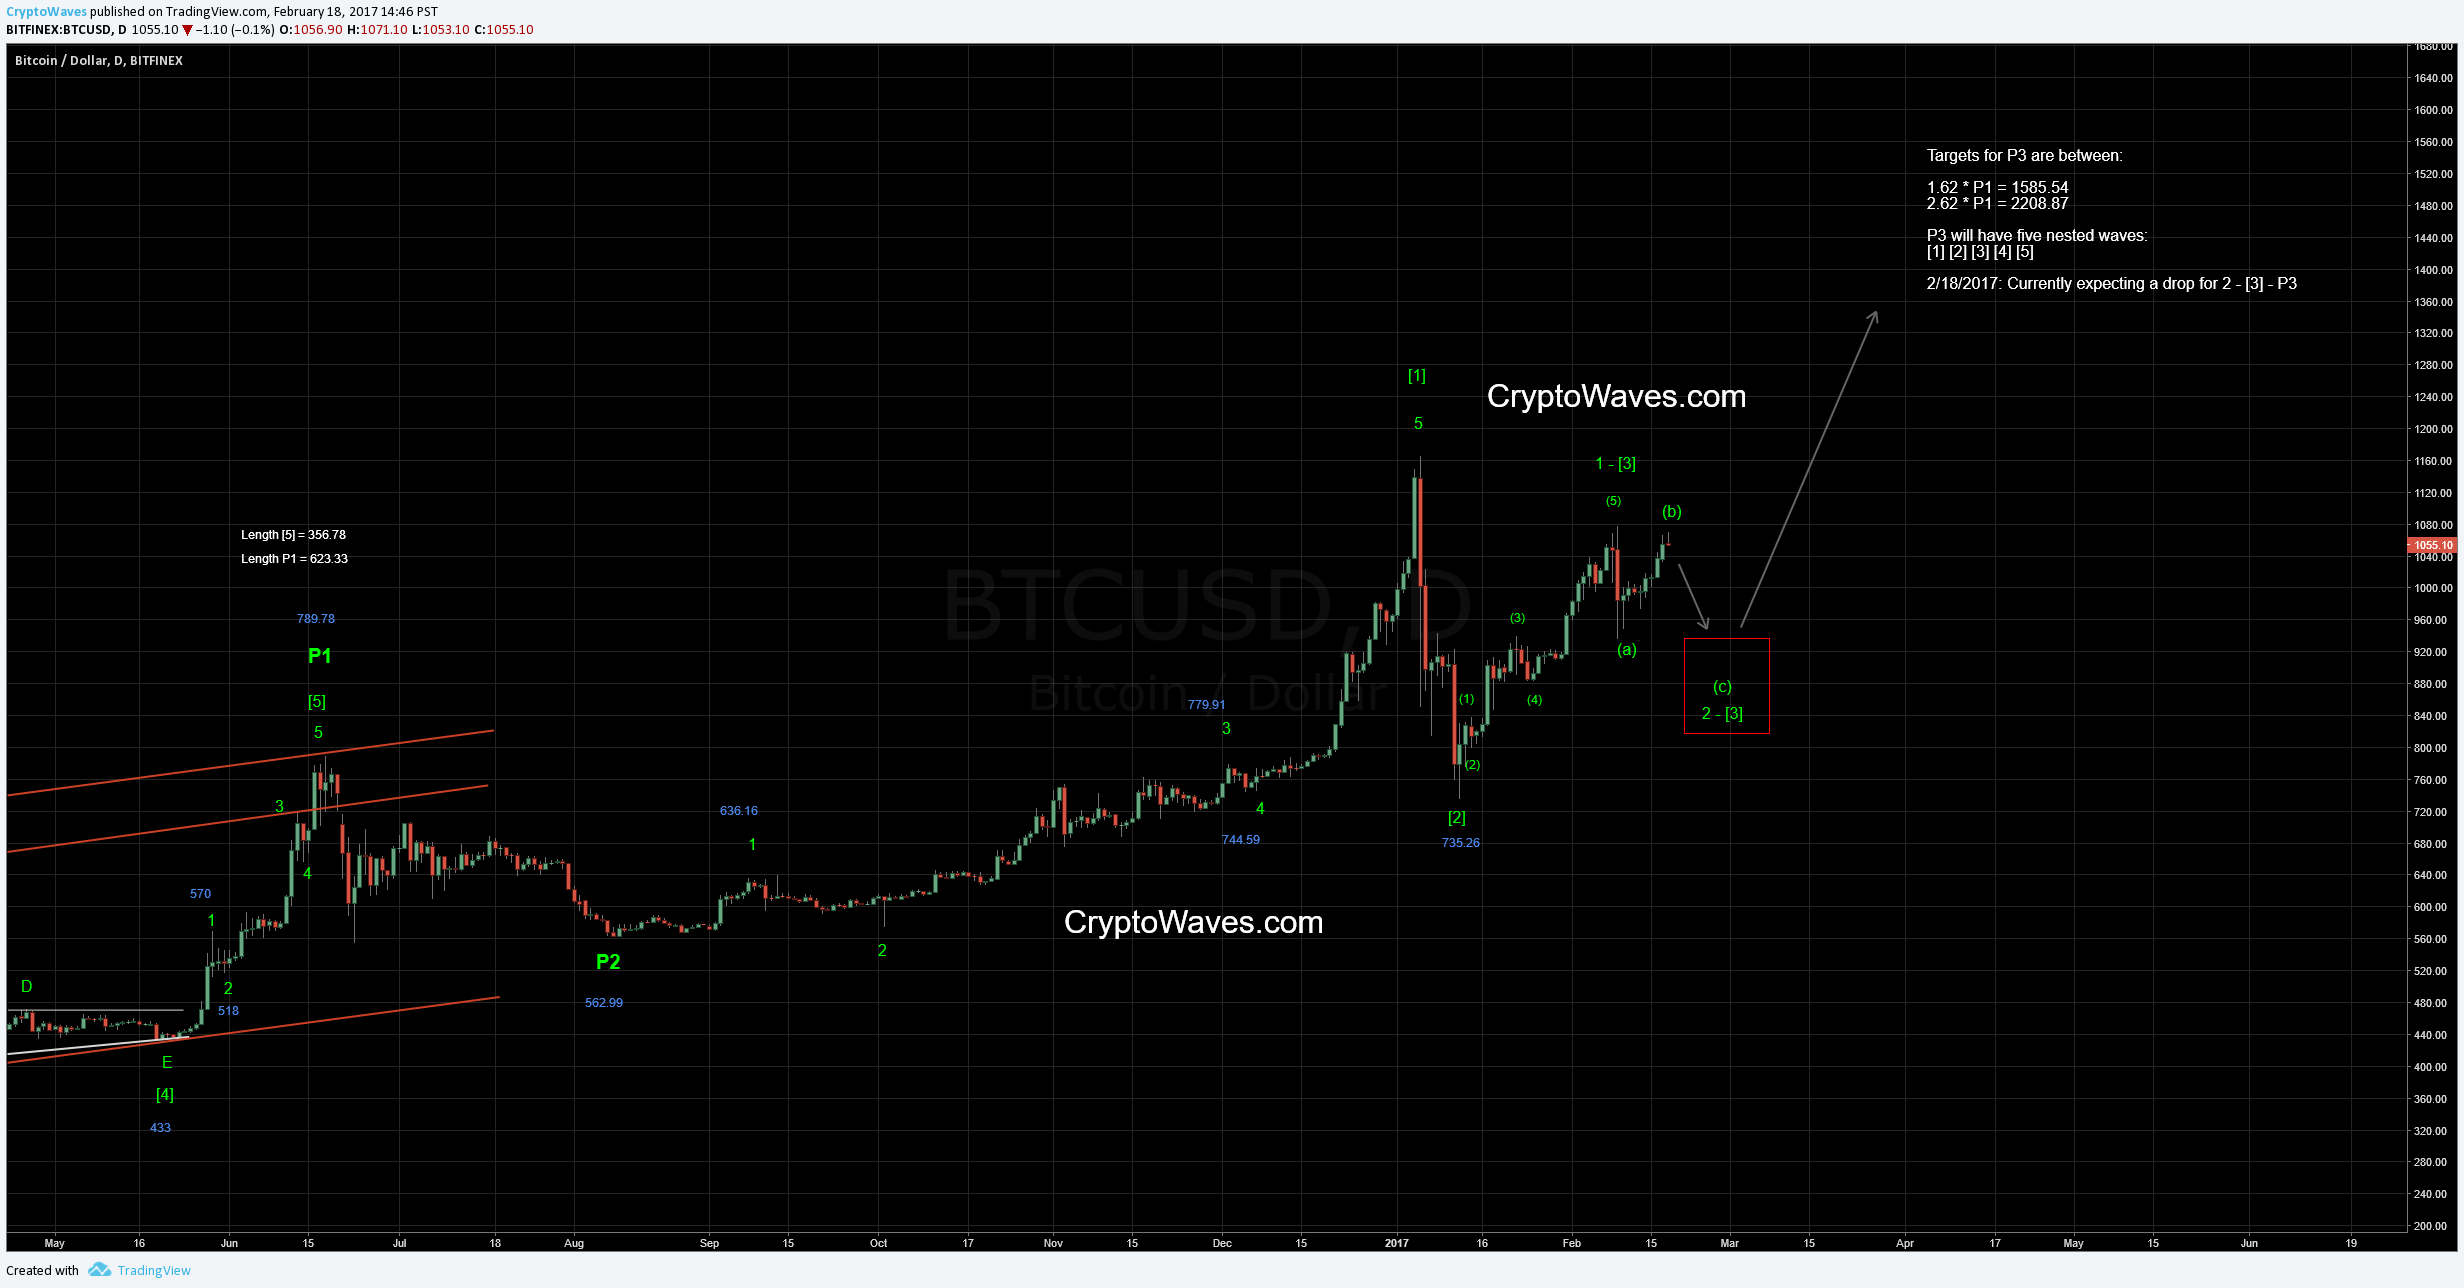
Please refer to the screenshot of the Bitfinex daily chart below to find my updated Elliott Wave count for the recent Bitcoin price movements.
I currently put bitcoin price in a wave 2 – [3] flat or expanded flat since the top for wave 1 – [3] that occurred in early February at the price of 1078. This flat correction will likely meet, or slightly exceed the (a) – 2 – [3] drop that went down to 936 shortly after the 1 – [3] peak. Current time estimates for the end of the 2 – [3] wave are in early March 2017.
Since December 2016 there has been tremendous buying pressure in bitcoin paired with swift drops in 2017 as reactions to news from China. The next known price catalyzing event to look out for is the Security and Exchange Commission’s deadline for the Winklevoss COIN ETF. The SEC must make a decision on the approval or disapproval of this ETF on or before March 11, 2017. Until then, we must watch as BTC price wafts below the 1 – [3] peak.

