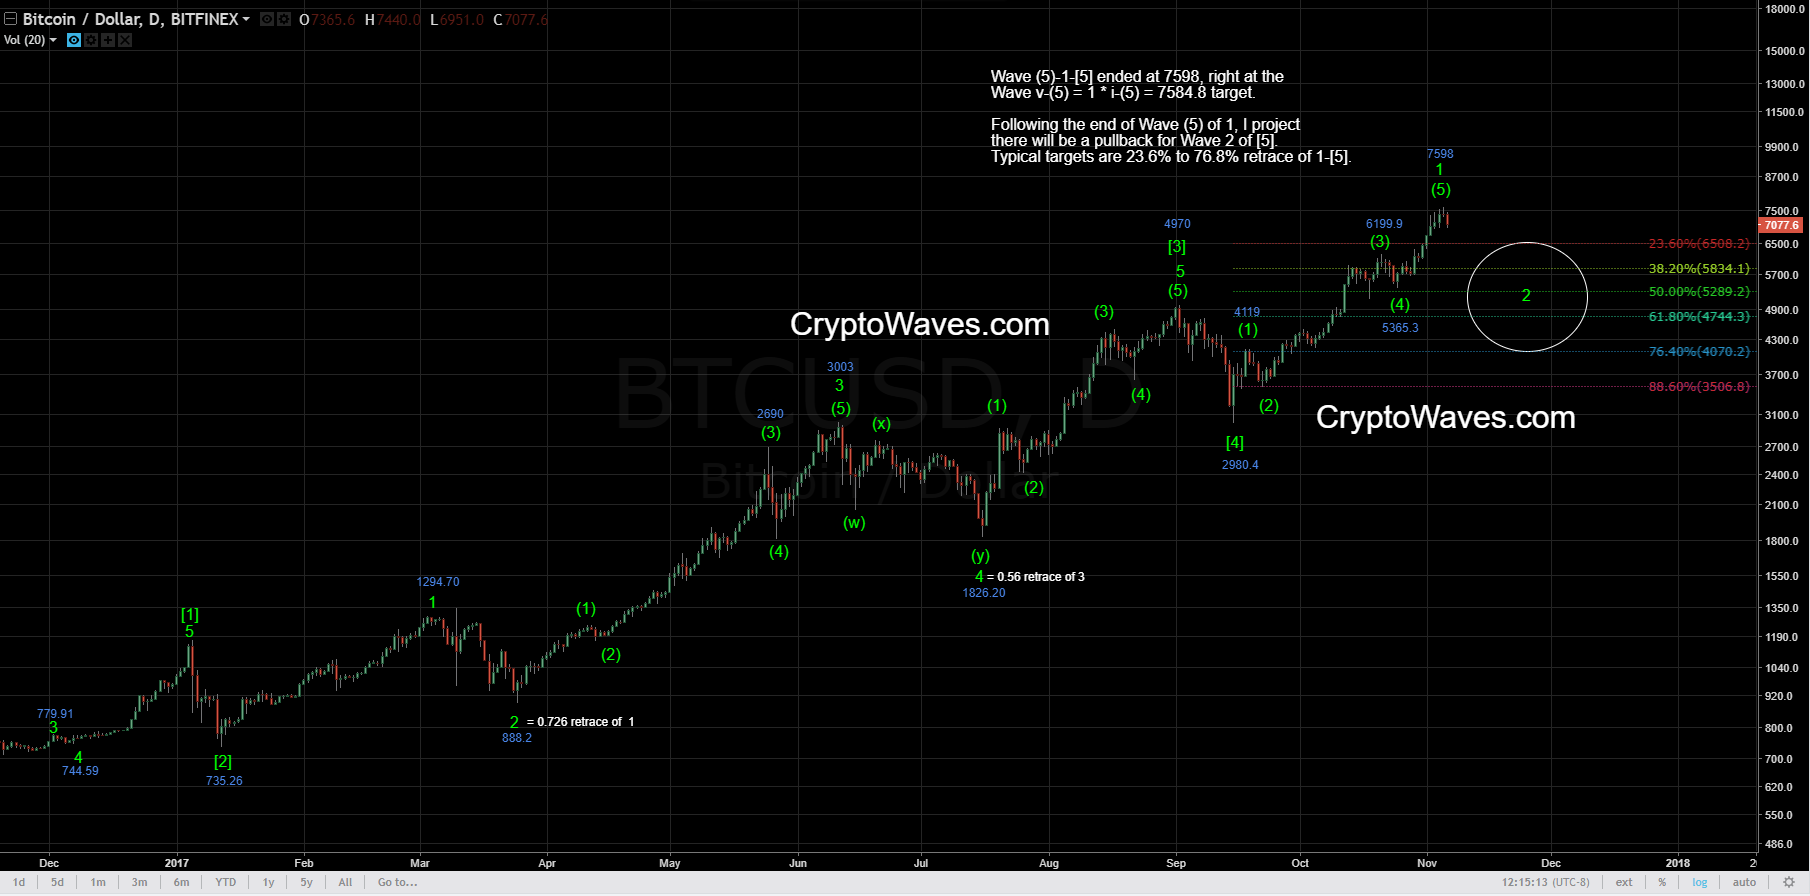
I have not updated my Bitcoin Elliott Wave count since July and since then, price has moved rapidly upwards, suggesting that Primary Wave 3 (P3) is still unfolding to the upside. I’ve revised the Major and Minor wave labels for my Elliott Wave count on the daily chart, as shown in the screenshot below. This chart is in logarithmic scale to better show the relative wave lengths compared to early 2017 and the last couple months.
Bitcoin price has found a local top at 7598, marking the end of wave 1-[5]-P3. Targets for the Minor wave 2-[5]-P3 correction are shown using the Fibonacci retracement tool. Typically, wave 2s retrace 38.2% to 76.8% of the previous wave 1 move. More details on projecting price movement for the current Minor wave 2 are given below.
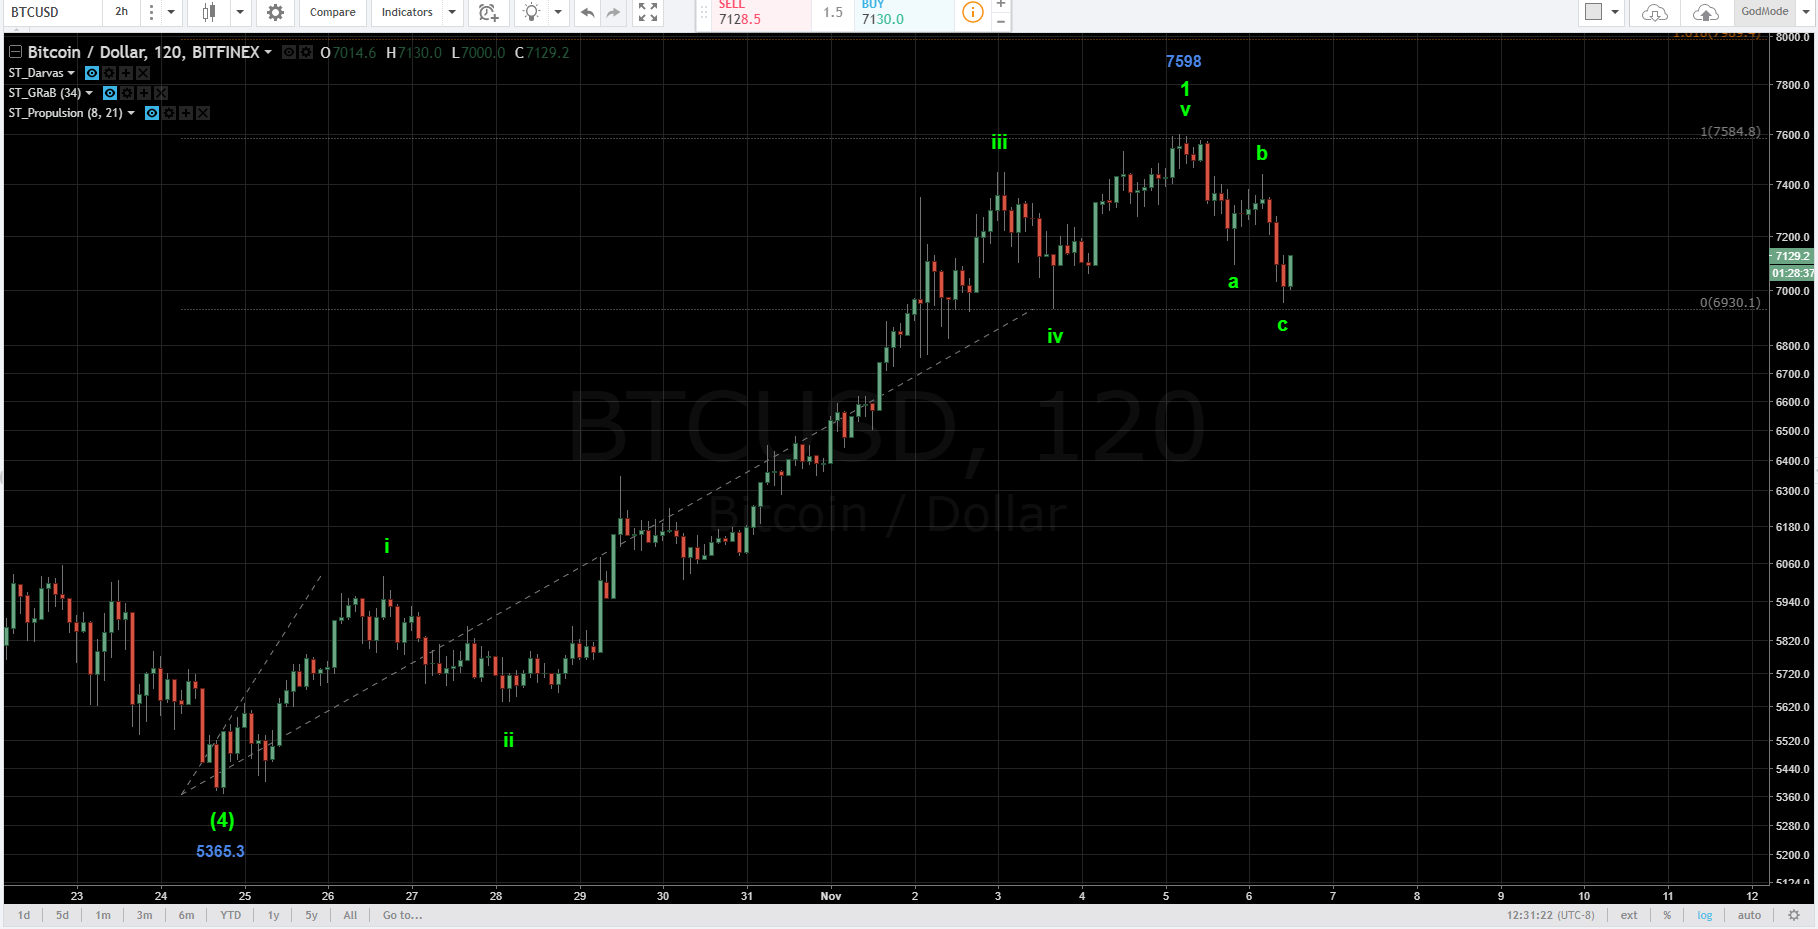
Counting the waves on the Minuette wave scale gave me confidence that this is the end of Minor 1, as we saw a clear five wave move off of the low made for Minute wave (4) at 5365. Also, by using typical wave extension ratios for Minuette v, we can see that Minor 1 ended right at at the wave v = wave i target (grey line shown in the 2-Hour chart below).
Now that a top has been found for Minor 1, price is working its way through Minor wave 2. Projecting targets for Minor wave 2 is difficult at this point in time until a bottom forms for the end of Minute Wave (a). I expect wave 2 to take the form of a single (a)-(b)-(c) zig-zag, or a complex corrective double zig-zag. Since wave 2 corrections have not usually lasted a long time for Bitcoin during this P3 rise, I expect that wave 2 will be a 3-3-5 zig-zag.
Today, price is working on the firs three wave move for Minute Wave (a). Once this completes, a bounce for Minute Wave (b) will commence. I’ll watch price and provide updates as the movements unfold.


1 comment
interesting point! thx keep on your work