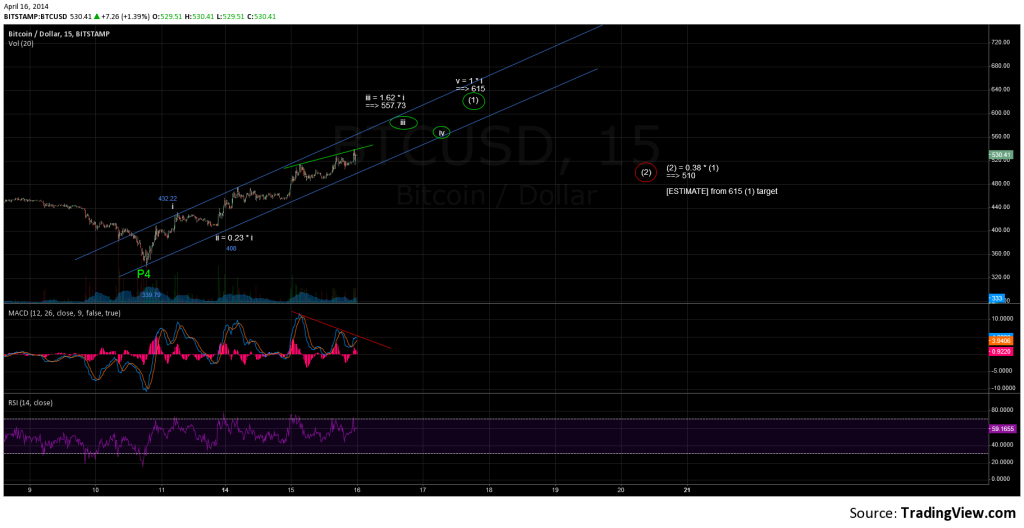
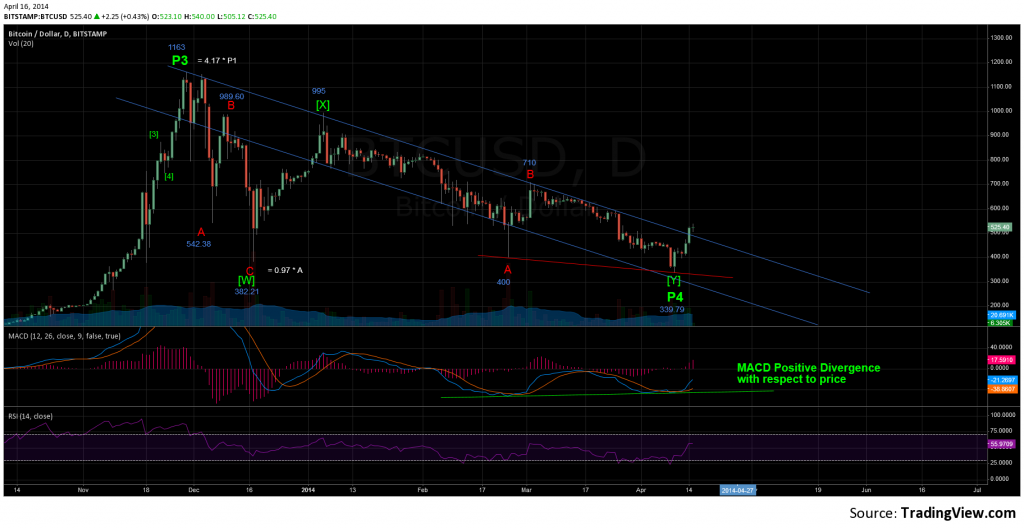
Bitcoin price has made a strong recovery from the low at 339.79 on 4/10. My current wave count has Primary Wave 4 (P4) ending at 339.79 at the 70% retrace of P3. This means that the Primary Wave 5 uptrend has started. Refer to the links below for the updated daily and 15 minute chart.
Some important notes on the daily chart:
The daily MACD made a bull cross (histogram above 0) from a deply oversold area. More importantly, the daily MACD formed positive divergence with respect to bitcoin price at the recent 339 low. I’ll explain this further for those unfamiliar with the concept of positive divergence. On the daily chart look how price made a lower low of 339 versus the previous low at 400, yet the daily MACD did not make a lower low when price hit 339. MACD positive divergence can be compared to the coiling of a spring ready to release all of its stored energy.
Price rose above the down sloping price channel (blue parallel lines on daily chart) and has stayed above this level for a day. This has been noted many other places on the web over the last day. Even so, it is important.
My short term target for the end of wave (1)-1-[1] of the current P5 uptrend is 615. This will be followed by a retrace for wave (2), estimated to be around 510.
Observations on the 15 minute chart:
There is MACD negative divergence with respect to price. This does not have importance for the long term trend since it is on the lower timeframe, but it could lead to slightly lower prices in the short term.
The technical indicators (RSI, stoch, and MACD) are in the overbought area on the lower timeframe charts. Price could move sideways around 530 for a half day or so to make these ‘reset’ lower and prepare for the next move up. Alternatively a slow, sustained move up would allow the indicators to not enter the extremely overbought area.
If price falls below 475, then wave iii has likely ended.


