
I finished the lower degree wave counting on the hourly Bitcoin chart. Linked below is a zoomed in view of the daily chart linked in my earlier post, which shows that Bitcoin price is working on a final C-[Y]-P4 move down. My hourly chart shows the details of this final C-[Y]-P4 move down. The moves down from the [X] high have counted very well on the hourly scale. All of the Fibonacci ratios for the minute waves shown (ex. (1), (2), (3)…) fell within the expected ranges.
Currently, Bitcoin price is working on a wave (4) move up to between $488 and $510. After the wave (4) move completes, price should drop in a wave (5)-C down to between $382 and $317. This agrees with my earlier targets from the prior daily chart, which had P4 ending between $380 and $308.
Timing on the wave (4) and wave (5) moves are estimated on the chart using the dark blue down-channel lines. A line was drawn from the wave (1)-C low at 604.5 and connected to the wave (3)-C low at 416.11. Then, a parallel line is placed at the wave (2) or ii-(3) high to create a down-channel. Assuming the count is correct, Bitcoin price should stay within this channel until the end of (5)-C. It is okay for price to move down outside of the channel, but if it rises up and outside of the channel, the count may need to be adjusted.
Important price levels to watch:
(4)-C cannot move above the (1)-C low at 604 and, more realistically, it should not move above the 62% retrace of (3)-C, which comes to 565.
On another note, if anyone knows of site that provides interactive and detailed charts with price data as good TradingView for Litecoin, Peercoin, Namecoin, Vertcoin, Novacoin and other high volume cryptocurrenices, please let me know. I would be willing to create wave counts for these other coins.
Enjoy the post and have a great weekend!
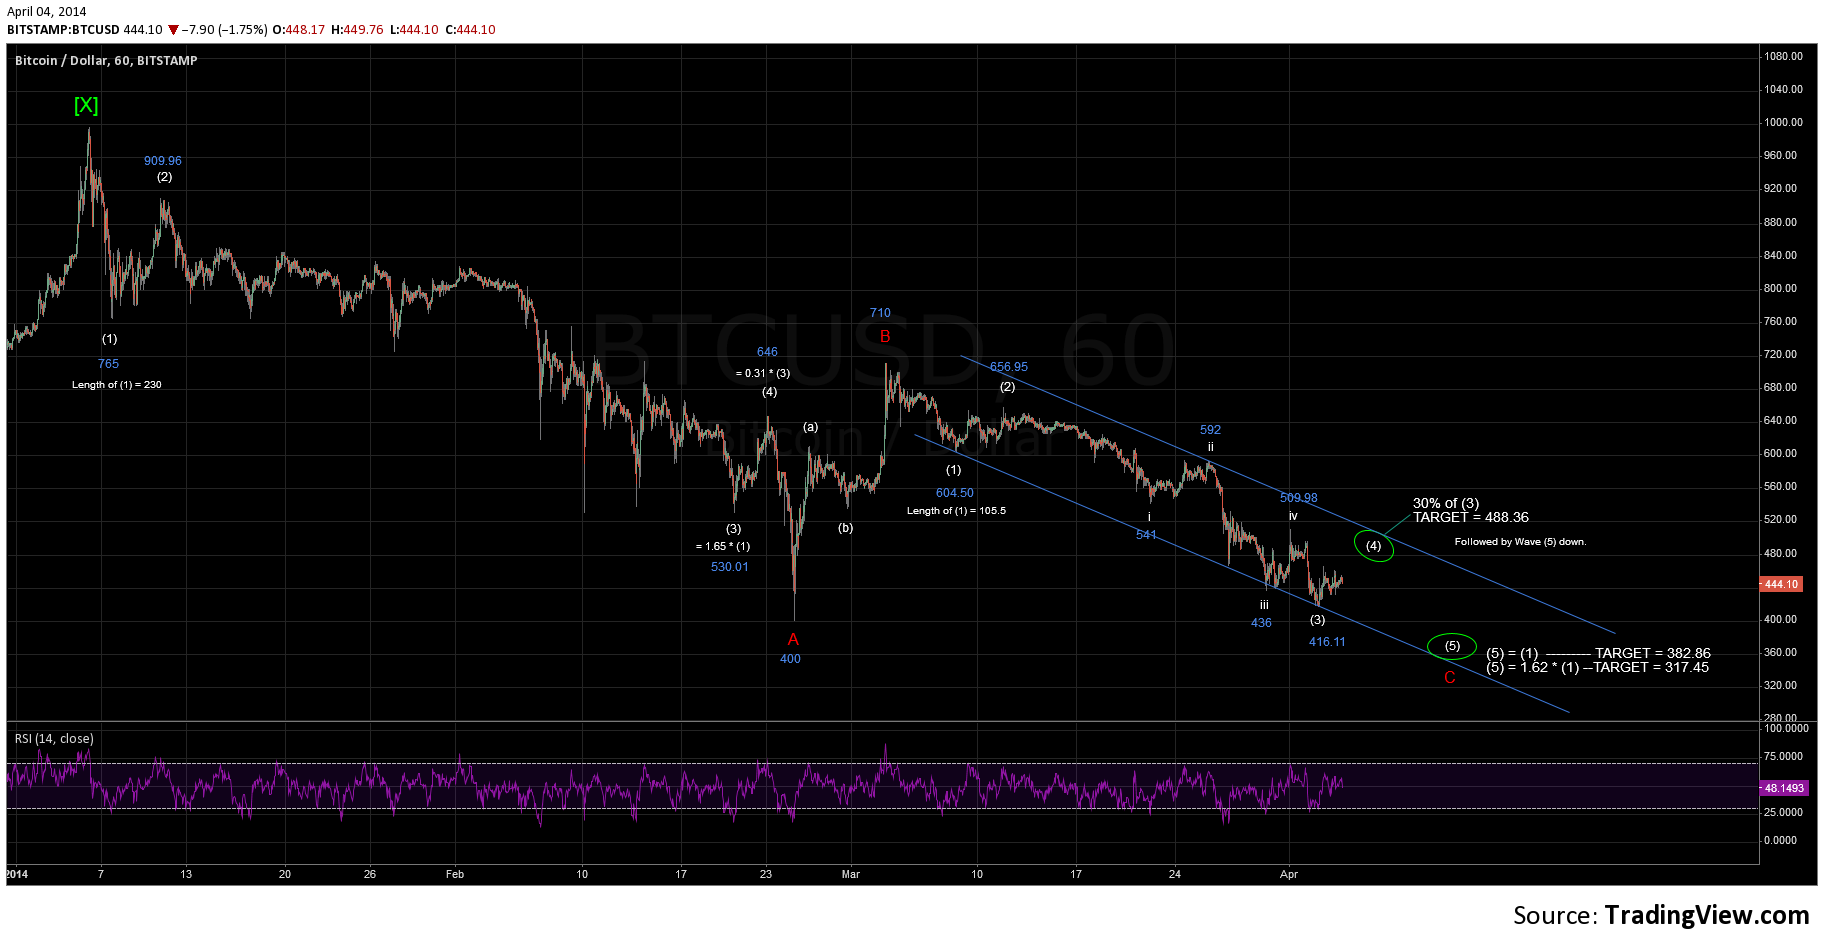
BTC Hourly – April 4th, 2014