
Bitcoin price looks to have found the bottom for [4] – P3. The triangle I proposed for the wave [4] correction in my last post turned into a double zig-zag that reached 1826, which is a 55% retrace of the [3] – P3. Refer to the updated daily chart for the new labels for this count.
With the decisive move off of the [4] – P3 low, it is pretty convincing that there’s still one more wave up for [5] – P3. Now, waiting for a pullback, or sideways consolidation for wave 2 – [5] – P3 as an opportunity to catch the next move seems like the best choice for those who may have sold in wave [4]. Caution is warranted for bulls if the wave 2 – [5] correction retraces more than 72.8% of the wave 1 move.
Conservative targets for the [5] – P3 wave are between 3200 and 3300. Wave [5] can extend upwards without limit though, so tracking the count on lower time frames as it progresses will be important. Wave [5] also can be complete any time after it passes the previous wave [3] high at 3003.
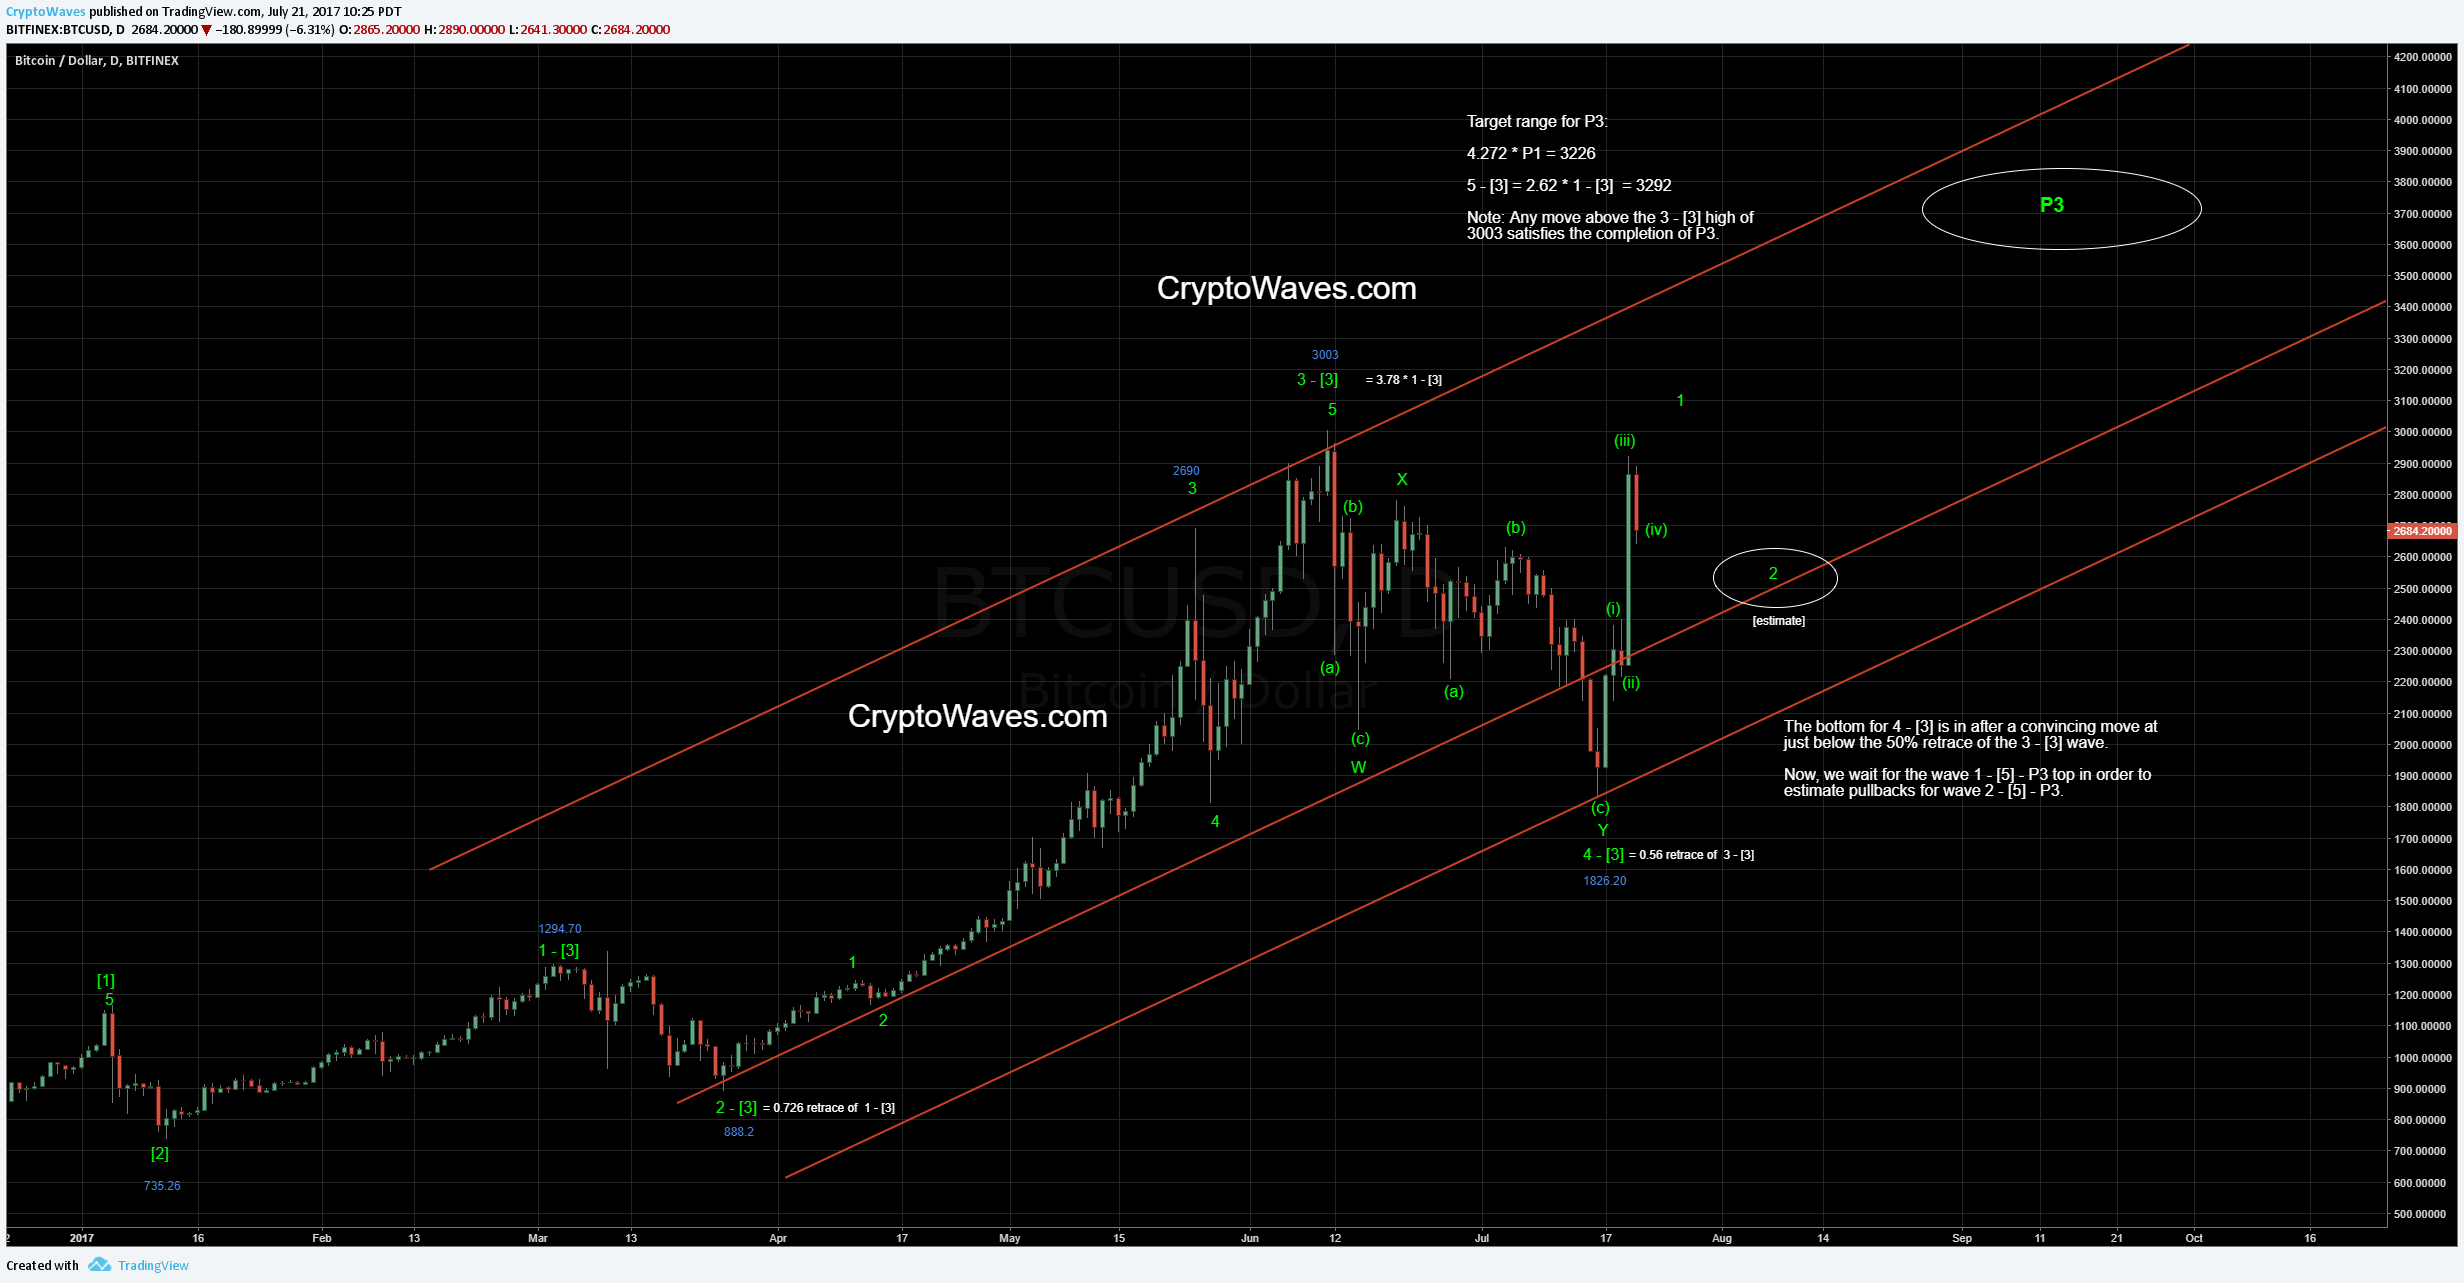
BTC / USD Daily Chart – July 21, 2017