
Hello everyone. Long time since I’ve made a post as a result of being busy with my day job. Getting back into it, but don’t have time to update the EWave count.
There’s a great momentum indicator I want to teach everyone about. In trading, we want to identify periods where price is setting up for a directional move. One way to do this is to use the bollinger bands and keltner channels combined with momentum.
The squeeze indicator combines bollinger bands and keltner channels to identify when the market is ready to move in a directional manner. Combined with momentum (shown at the bottom), we can get a good idea of which way the trade will move. This works on any timeframe, but it is the strongest on the longer time frame charts, ie the weekly and the daily. The indicator is valid for 6-10 time periods. For the daily squeeze, it is vaild for 6-10 days of upward movement.
In this case, the squeeze triggered when the yellow bollinger band moved inside of the blue keltner channels. Momentum is trending upwards, so I’m expecting BTC to move to the upside. The last daily squeeze that triggered long was the long run from 440 to 680.
BTC price dropped slightly to the 8 day EMA. I moved into a long position at 631 with 2/3 of my total position size and will add 1/3 if it drops to the 21 day EMA. My stop is a close below the 21 day EMA.
Happy 4th of July and wishing you all of the best in your trading! I will get back into posting more going forward.
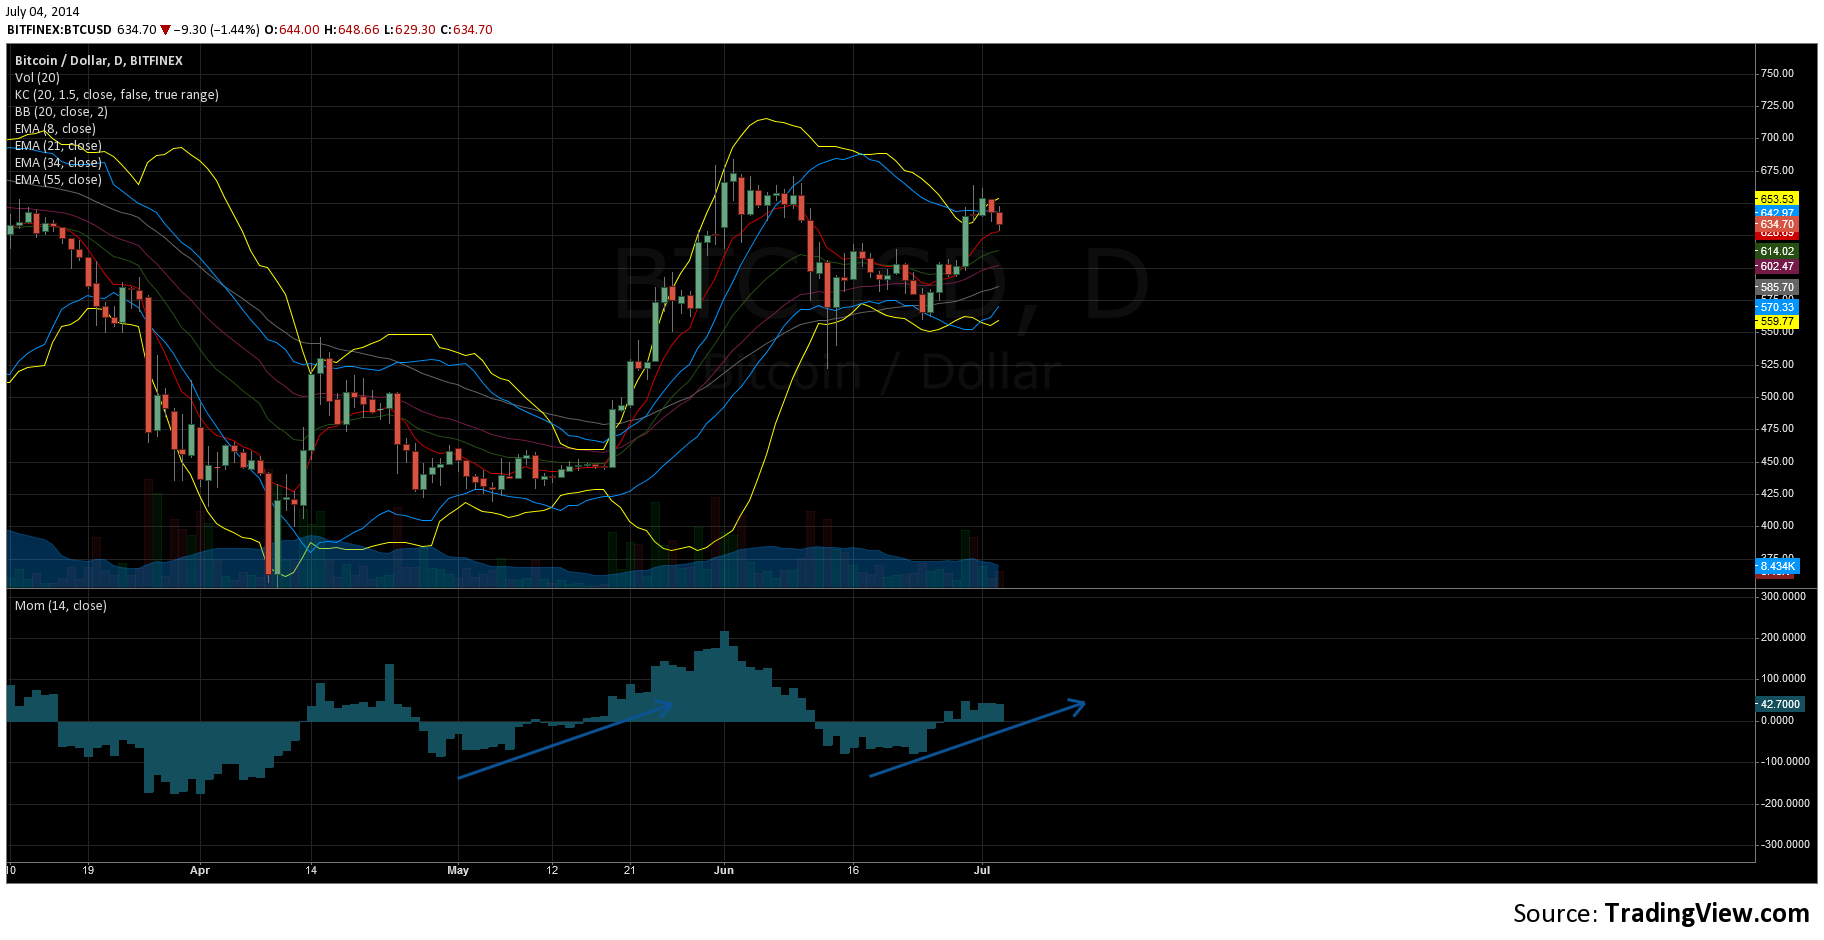
Daily Squeeze on BTC – July 4th, 2014