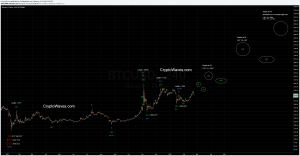
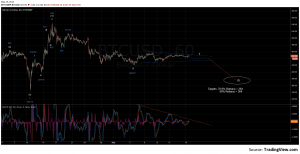
Bitcoin price has been difficult to chart during most of 2015, so I have not updated the count for quite some time. I took a look at the charts again and propose a bullish count for the bitcoin daily chart, seen below. Most of 2015 was spent in a tight range between about 300 …
Aug 11
Bitcoin / USD Hourly Wave Count – August 11th, 2014
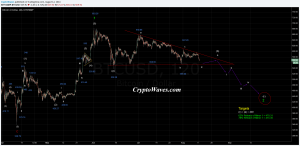
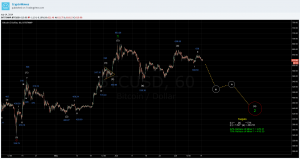
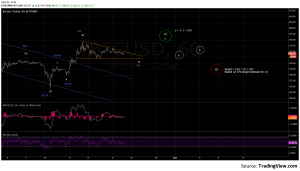
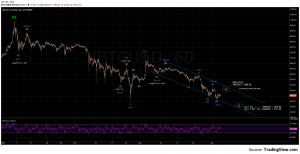
Bitcoin price is still in a Minor 2 correction, as outlined in the hourly chart below. The price movement since the recent high at 658 has not been extremely impulsive to the downside, as I would expect for a (c) of Minor 2 move down as was proposed in the latest wave count on July …
Jul 19
Bitcoin Price Commentary – July 19th, 2014
Hi Everyone, At this time, I am still waiting for Bitcoin price to make a decisive move in one way or the other. I wrote the following elsewhere on the web, so I decided to post it here for everyone else to see. Good trading! From my post last night, I show through my …
Jul 18
BTC Daily Squeeze – July 18th, 2014
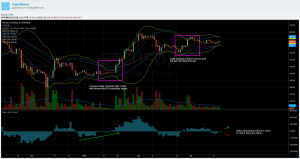
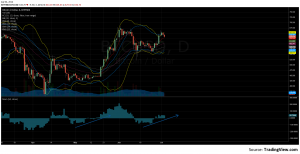
Another daily squeeze has formed on the daily chart for Bitcoin. The last one did not follow through with its move. Let’s see what it has in store this time. The squeeze triggers once the yellow Bollinger Bands move outside of the dark blue Keltner Channel. So, we are in waiting mode right now. After …
Jul 14
Bitcoin / USD Hourly Wave Count – July 14th, 2014
I found time to update the hourly Bitcoin / USD wavecount – let’s dive into the details. The recent top at $683 is labelled as the end of Major 1, meaning Bitcoin price is currently working on a Major 2 retrace. The drop down to 538 caused an overlap with the labelled Minute wave (1) …
Jul 04
Long BTC on Daily Momentum Squeeze Indicator
Hello everyone. Long time since I’ve made a post as a result of being busy with my day job. Getting back into it, but don’t have time to update the EWave count. There’s a great momentum indicator I want to teach everyone about. In trading, we want to identify periods where price is setting up …
May 19
Bitcoin / USD Wave Count Update – May 19th, 2014
Bitcoin price has been difficult to count and indecisive for the past month. Let’s start this update by taking a look at the daily chart for clues on the current trend. I notice the following important points from the daily chart. Price has failed to stay above the 21 day EMA (listed on top left …
Apr 22
Bitcoin / USD Wave Count Update – April 22nd, 2014
Bitcoin price has been range bound after the recent rise to 548. The overlapping wave structure and shallow price movement suggest that the wave count is still in wave iv-(1). Wave iv is playing out as a descending triangle where price moves sideways as technical indicators move lower in preparation for the next move up. …
Apr 16
Bitcoin / USD Wave Count Update – April 15th, 2014
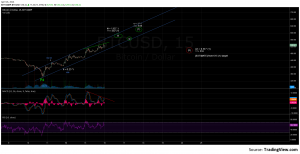
Bitcoin price has made a strong recovery from the low at 339.79 on 4/10. My current wave count has Primary Wave 4 (P4) ending at 339.79 at the 70% retrace of P3. This means that the Primary Wave 5 uptrend has started. Refer to the links below for the updated daily and 15 minute chart. …
Apr 04
Bitcoin / USD Hourly Wave Count – April 4th, 2014
I finished the lower degree wave counting on the hourly Bitcoin chart. Linked below is a zoomed in view of the daily chart linked in my earlier post, which shows that Bitcoin price is working on a final C-[Y]-P4 move down. My hourly chart shows the details of this final C-[Y]-P4 move down. The moves …

